


LTV Technologies Supplies Safety Solutions
LTV Tech, our mission is to pioneer solar safety solutions. With PVSTOP, We are dedicated to providing a reliable shield for solar systems, ensuring the instantaneous and secure shutdown of panels during emergencies. Our liquid blanket technology stands as a testament to our commitment to a safer, more resilient solar power landscape in the face of unforeseen crises
- Swift Deactivation
- Rapid Response
- Portable and Versatile
- All-Weather Reliability
- Quick Drying Properties
- Fire Retardant Properties
- Easy Peel-Off Application
- Nonconductive Safety
- Effortless Disposal
Solutions during EmergenciesDeactivation Solare Panels Safely
PVStop allows selective deactivation of solar panels, providing flexibility by interrupting solar power production with minimal coverage , while covering the entire panel reduces DC voltage to zero


Solar Farms Commercial Installations Industrial InstallationsResidential Solar SystemsEmergency ServicesSolar Panel Maintenance
PVStop is used in various settings with solar energy installations to safely de-energize PV arrays during fires or emergencies, providing a versatile solution beyond addressing internal PV system fires.
Recent Blog Post Blog Post Blog Post
Explore the innovative safety solution with PVStop – a fire-retardant spray designed for solar panels. Learn how PVStop ensures quick and safe de-energization during emergencies, making it a versatile tool for enhanced electrical safety in solar energy installations

Calculating consequences matters more than counting PV fires (for now)
When people talk about solar-PV fire risk, the first question is almost always:
“But how many PV fires are there really?”
It sounds reasonable and scientific. Insurers want loss data. Fire services want incident statistics. Policy-makers want trend graphs before they move.
The problem is simple and brutal: for PV fires, the data we have today is full of holes by design. If you wait for “perfect statistics” before you act, you are effectively choosing to stay blind.
That’s why a consequence-based approach is not just useful – it’s essential. For the next few years, calculating consequences of a PV fire at a given site will often tell you more than any national database can.
1. Why today’s PV fire data can’t be trusted on its own
In most countries (including South Africa), PV fire statistics are weak for structural reasons, not because PV is magically safe.
1.1 PV isn’t tagged properly in incident systems
Fire incident reporting systems were not built with PV in mind. A typical form might have:
- “Electrical fire”
- “Roof fire”
- “Equipment fault”
…but no dedicated tick-box for “solar PV present” and no way to mark “PV suspected as ignition source”.
So even when a fire service attends a real PV-driven roof fire, the database might record it as:
“Electrical – other” in a normal building fire.
The PV disappears into the noise. When you later pull national stats, PV almost doesn’t exist – not because it isn’t burning, but because it was never labelled.
1.2. Near-misses are almost invisible
The most important signals in a complex system are often not the disasters, but the “almost disasters”:
- DC connectors that melted but didn’t ignite timber
- DC isolators that smoked and were quietly replaced
- Combiner boxes that showed scorch marks or arc damage
- Cable damage found on thermography inspections
These events rarely go into a central, searchable system. An installer might fix them. An O&M contractor might log them locally. An insurer might never hear about it.
From a risk perspective, these near-misses show you how often the system tries to fail. From a data perspective, they are mostly invisible.
1.3. No regulatory or contractual duty to report
In most markets, no standard regulation or insurance condition tells people clearly:
- “If a PV component fails or nearly ignites, you must report it to X, and they must record it like this.”
Without that, everyone assumes someone else is tracking the problem. Result:
- Installers fix and move on
- Owners claim under “electrical”
- Fire services fight the fire and close the file
You end up with national statistics that say “PV fires are rare”, but only because nobody asked the PV question on the form.
1.4. Rapid rollout + mixed quality = hidden risk
Most countries have seen a rapid, sometimes chaotic rollout of rooftop PV:
- Highly variable installer competence
- Grey-market components and poor QA
- Limited inspections or enforcement
- Harsh climate and rooftop environments
All of these increase the underlying defect and ignition risk, but not the recorded risk. The more we install without proper tracking, the bigger the gap between “what’s in the database” and “what’s happening on roofs”.
2. The actuarial trap: waiting for numbers that can’t exist
Insurers and policy-makers are used to a world where:
“We’ll act when the data is strong enough.”
For PV fire risk, that mindset becomes a trap:
- The system isn’t designed to see PV risk
- So the statistics show almost nothing
- So nobody justifies the cost of better controls
- So the system remains blind
It’s a closed loop of inaction.
In that situation, chasing perfect frequency data is less useful than asking a different question:
“If this PV system did catch fire, what would the consequences be?”
That question you can answer today, very clearly and very locally, without pretending to have national-level fire curves.
3. Consequence-based thinking: what it actually means
When we talk about “calculating consequences”, we’re not hand-waving. We’re doing structured, repeatable assessment along three dimensions:
- People (P) – impact on life and health
- Could anyone realistically be injured or killed?
- How many people, how vulnerable, how complex is evacuation?
- What about the firefighters under that live DC roof?
- Assets (A) – damage to property and equipment
- What could be destroyed?
- A few panels and some sheeting, or an entire roof and all stock below it?
- Are there high-value assets: machinery, switchgear, archives, servers?
- Business / Service (B) – impact on operations
- How long would operations or services be interrupted?
- Is this a warehouse, a small office, a school, a hospital, a data centre?
- Would the community lose an essential service?
In practice, you score each 1–5 (low to very high) and combine them into a Consequence score C (1–5) with clear rules and a strong bias toward life safety.
The exact maths can vary, but the essence is:
- People dominates the score
- Assets and service disruption refine the picture
- You end up with a consistent, transparent “how bad could it be here?” number
This is not guesswork. It’s structured engineering judgement, based on building type, layout, occupancy, construction, and what sits under the modules.
4. Why consequence matters more than incomplete PV fire data
4.1. Consequence tells you where you cannot afford to be wrong
Imagine two roofs:
- A small farm shed with a 5 kW array over non-combustible sheeting, rarely occupied.
- A hospital ICU ward with a dense array over combustible roofing, full of oxygen, cables and vulnerable patients.
National statistics might show “very few PV fires”. But if we are honest:
- A PV fire on the shed is unfortunate.
- A PV fire on the ICU is catastrophic.
The consequence is completely different, even if the likelihood of an ignition event is similar.
So as a fire service, insurer or risk manager, which one keeps you awake at night? The ICU, every time.
Consequence-based scoring forces you to prioritise the sites where being wrong has the highest price, regardless of how incomplete the fire database still is.
4.2. Consequence is local and knowable today
You don’t need ten years of perfect incident data to know:
- This school’s only escape route is under a live array.
- This warehouse holds flammable stock under a massive DC field.
- This clinic’s emergency power is critical for patient survival.
Those are site facts, not statistics. You can inspect them, document them, and score them now.
4.3. Consequence guides sensible, targeted controls
Once you understand C (the consequence), you can tailor your effort:
- High-consequence sites (hospitals, malls, big schools, critical infrastructure):
- Clear shutdown / de-energisation methods
- Stricter design standards and component choices
- More frequent inspections and thermography
- Mandatory, PV-specific firefighter SOPs and tools
- Lower-consequence sites (small standalone sheds, remote carports):
- Proportionate requirements, fewer bells and whistles
- Lower inspection frequency
You get more safety per Rand spent, because you are not treating every roof like an ICU, and you are not pretending that all roofs are equally harmless.
5. Where likelihood still fits in (and how we use data honestly)
None of this says that frequency data is useless. It’s just not ready to drive decisions on its own.
The mature way to think about PV fire risk is:
Risk = Likelihood × Consequence
- Consequence (C) you can score reliably today using a structured framework (People, Assets, Business).
- Likelihood (L) you derive from technical risk factors:
- DC connectors and isolators
- Workmanship quality
- Array design
- Environmental exposure
- Maintenance and inspection regime
As we improve data capture — better incident tags, near-miss reporting, insurance flagging — the L side can be refined using real numbers:
- “Connectors of type X, in climate Y, with age Z, show this failure rate.”
But we don’t have to sit on our hands while we wait for that future. We can act now on high-consequence sites based on what we already know about fire behaviour, building use, and PV failure modes.
6. The practical message for decision-makers
If you’re an insurer, a fire service, a facilities manager or a regulator, the takeaway is simple:
- Accept that current PV fire stats are under-reporting by design.
The lack of numbers does not equal lack of risk. - Start evaluating consequence at site level.
Use a transparent 1–5 scale for People, Assets and Business / Service, and combine them into a single Consequence score. - Prioritise high-consequence roofs and systems now.
These are the ones where a single PV-initiated fire can produce deaths, huge losses or public scandal. - Improve data in parallel, not first.
Add PV tick-boxes to incident reports, encourage near-miss reporting, and ask insurers to flag PV-related claims — but don’t wait for the perfect dataset before you move. - Use the formula, but respect the reality.
Risk = Likelihood × Consequence. Right now, Consequence is the side we can measure best. Use it.
Final thought
In a world where the PV fire dataset is full of holes, insisting on “perfect numbers” before taking PV safety seriously is like refusing to wear a seatbelt until you’ve personally reviewed every crash report in the country.
We already know enough to see where a PV fire would be devastating.
Consequence-based assessment simply forces us to admit it — and act accordingly.
Contact you PVSTOP Tecnical partner today
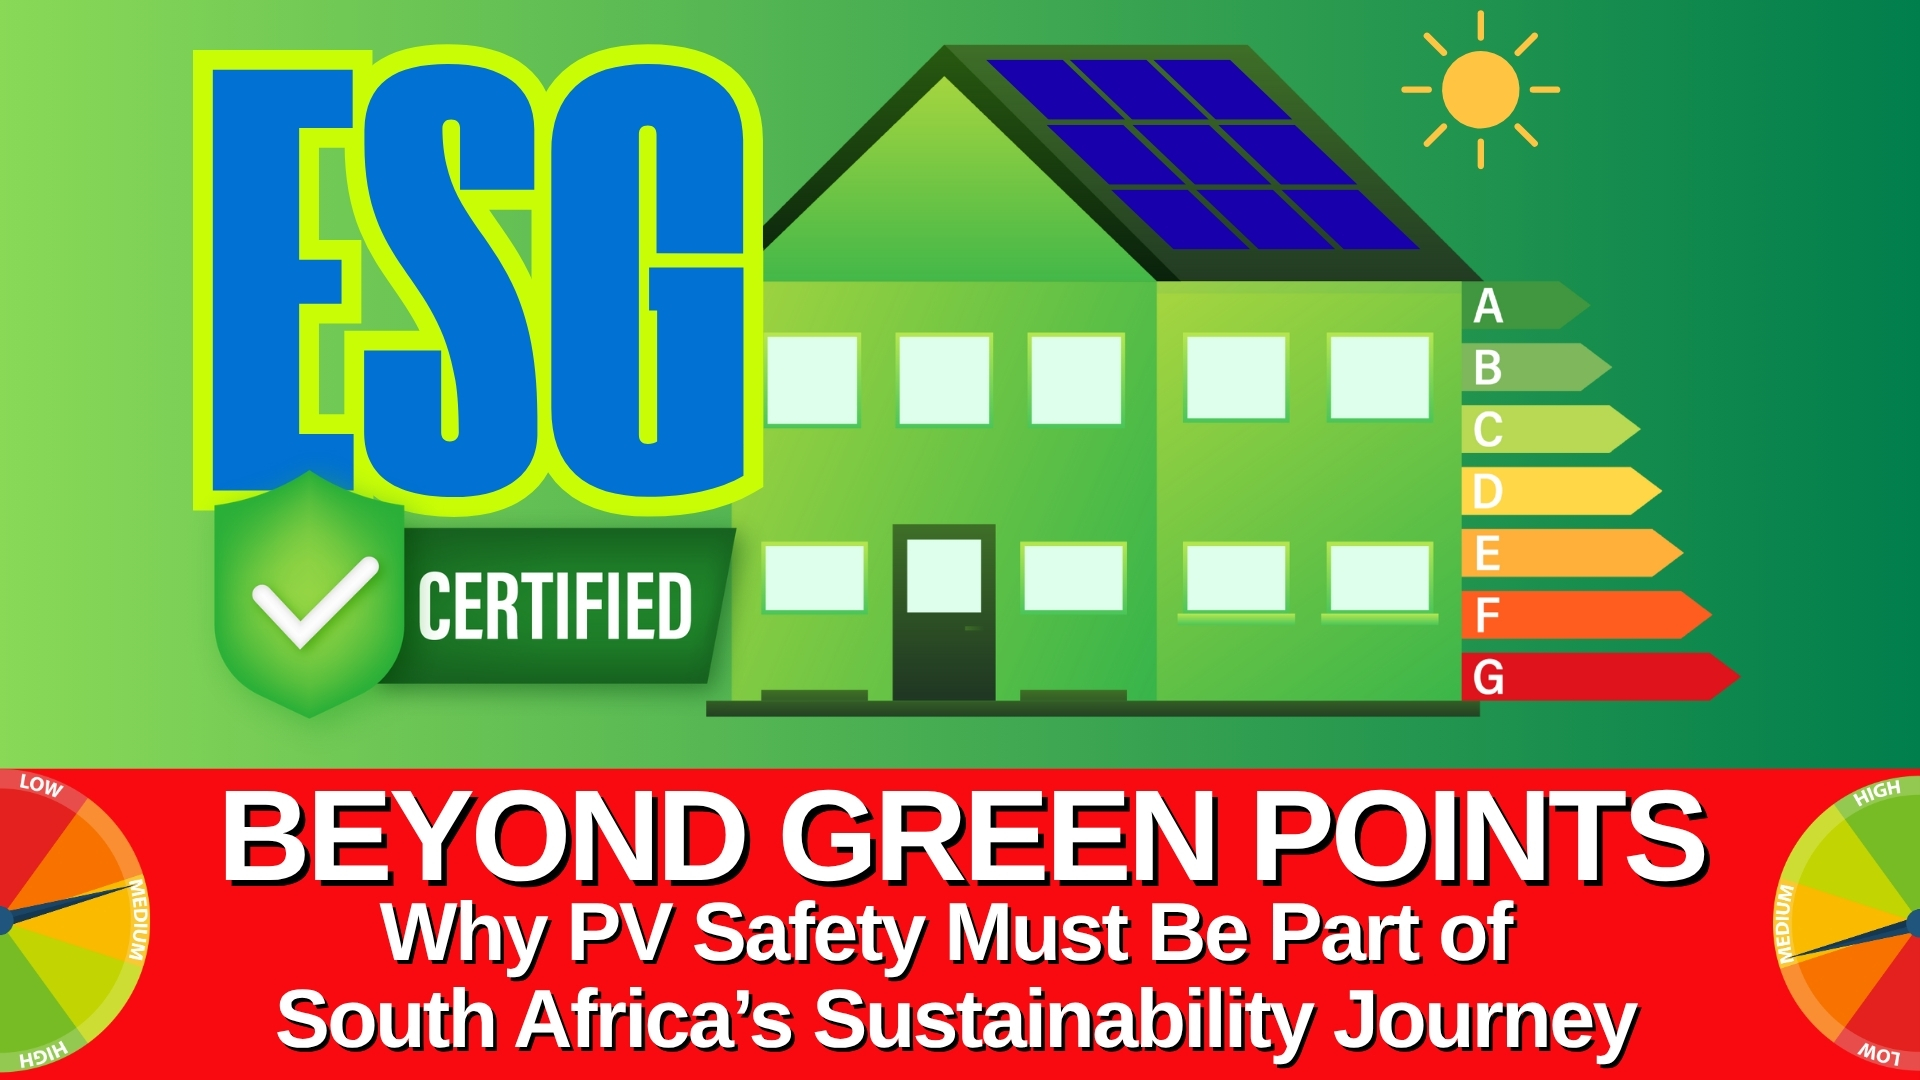
ESG Beyond the Green Points
Why PV Safety Must Be Part of South Africa’s Sustainability Journey
Published by: PVStop South Africa
Author: Johan Bosman – CEO, LTV Technologies & Supplies / Civitas Risk Control
The Hidden Gap in South Africa’s Green Building Movement
South Africa’s renewable energy transition is accelerating. Thousands of buildings are installing solar PV systems to reduce electricity costs and meet Environmental, Social & Governance (ESG) targets. But as the race for “green points” continues, a crucial question remains unanswered:
Who is managing the risks that come with solar power?
While ESG frameworks reward the adoption of clean technologies, they often overlook the safety, maintenance, and lifecycle risks introduced by photovoltaic (PV) systems. A sustainable building isn’t just one that produces clean energy — it’s one that can also prevent loss, protect life, and ensure operational continuity when things go wrong.
The Current Compliance Landscape
Under the National Energy Act (Act 34 of 2008), the South African government requires all qualifying non-residential buildings to display and submit Energy Performance Certificates (EPCs). These certificates measure a building’s energy consumption (kWh/m²/year) and form part of the country’s broader ESG reporting drive.
However, EPC regulations focus purely on energy efficiency, not risk mitigation. They do not assess:
- Fire and electrical risks associated with live PV systems;
- The ability to de-energize panels during emergencies;
- Safe roof access, walkway grip, or working-at-heights conditions;
- Environmental impact from chemical or water-intensive cleaning;
- Ongoing maintenance and inspection governance.
This creates a major gap between compliance and safety — a gap that forward-thinking building owners can now close.
ESG: More Than Energy — It’s About Responsibility
ESG frameworks were never meant to be limited to energy efficiency.
Each ESG pillar calls for deeper responsibility:
| Pillar | Intended Purpose | Current Gaps in PV Context | Solutions from LTV Technologies & Civitas Risk Control |
|---|---|---|---|
| Environmental | Reduce carbon footprint and protect natural resources | No oversight on PV fire risk, chemical runoff, or unsafe disposal | PVStop prevents PV fires and contamination; Fire-Retardant Coatings add fire protection barriers |
| Social | Protect people and communities | Roof workers, firefighters, and occupants face constant DC voltage hazards | EvacuPlan defines DC Danger Zones and safe evacuation procedures |
| Governance | Ensure ethical, transparent, and compliant operations | No formal PV safety or maintenance governance | ArcBox and PASRAM (in development) establish standards and inspection protocols |
True ESG alignment requires acknowledging that you can’t switch off the sun — and that solar safety must be part of every sustainability strategy.
Introducing Practical ESG-Aligned PV Safety Solutions
LTV Technologies & Supplies, together with Civitas Risk Control, deliver a suite of Tier-1 safety products and compliance tools designed to close this ESG gap:
- PVStop® – A patented, Class 0-certified solar panel coating that safely de-energizes live PV systems during fire or flood events, protecting responders and assets.
- ArcBox® / Viridian Solutions – Engineered to prevent DC connector arcing, one of the most common causes of PV-related fires.
- EvacuPlan™ – A digital and physical evacuation planning system that identifies DC danger zones and guides safe emergency response actions.
- Fire-Retardant Coatings – Adds an extra layer of structural protection between PV arrays and the roof surface.
Together, these technologies form a complete PV risk mitigation framework, enabling building owners, engineers, and insurers to demonstrate responsible ESG practice.
Why This Matters for Insurers, Engineers, and Property Owners
Insurers are increasingly linking ESG risk to underwriting and premiums.
By integrating PV safety and lifecycle governance into your building operations, you not only comply with the Energy Performance Certificate regulations — you also:
✅ Strengthen your ESG and insurance readiness
✅ Reduce liability for PV-related fire and safety incidents
✅ Improve your long-term building valuation and asset resilience
✅ Align with international best practice and reporting standards
Final Word
“True sustainability isn’t just clean — it’s safe.”
As South Africa moves toward mandatory ESG and EPC compliance, building owners have a unique opportunity to lead the next evolution of responsible energy.
By partnering with LTV Technologies, Civitas Risk Control, and PVStop South Africa, you can transform your PV system from a compliance checkbox into a verified, risk-managed, ESG-aligned asset.
Suggested Section to Add at the End of the Article
You can title it:
Further Reading & Regulatory References
To understand how PV safety and ESG compliance intersect, explore these key resources that shape South Africa’s sustainable building and energy safety framework:
- Government Gazette No. 43972 (Notice 700 of 2020) –
Regulations for the Mandatory Display and Submission of Energy Performance Certificates for Buildings under the National Energy Act (34 of 2008).
View on Government Printing Works - National Energy Act, 2008 (Act No. 34 of 2008) –
Defines South Africa’s national energy efficiency and management framework, but currently lacks detailed risk mitigation requirements for PV systems.
Read summary on Energy.gov.za - Occupational Health and Safety Act, 1993 (Act No. 85 of 1993) –
Provides for safe working environments and can be extended to include safe access to PV roofs, anchor points, and fire safety training.
See Department of Employment & Labour - SANS 10400-T: Fire Protection Regulations for Buildings –
Governs fire safety and evacuation planning but does not yet address the presence of active PV systems during fires.
(SABS Standard, available from sabs.co.za) - CIPC ESG Disclosure Requirements (2025 Rollout) –
South Africa’s new ESG disclosure rules will make environmental and safety data mandatory for reporting entities.
Learn more on CIPC’s ESG page
These regulations form the foundation of compliance — but together they reveal a missing link: PV risk mitigation and lifecycle safety.
PVStop, ArcBox, and EvacuPlan are designed to bridge that gap and bring ESG accountability to the solar industry.
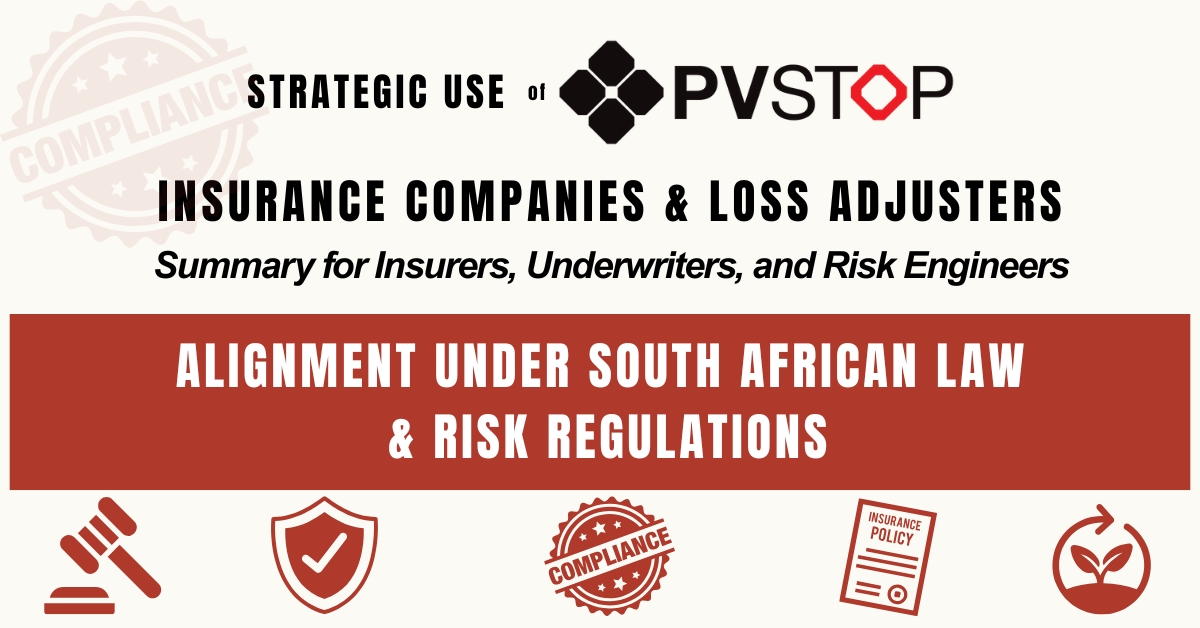
PV Fire Risk: Insurance Compliance in South Africa
Across South Africa’s fast-growing solar industry, the fire risk associated with photovoltaic (PV) installations remains one of the most misunderstood aspects of both building compliance and insurance liability. While fire departments operate under the Fire Brigade Services Act (No. 99 of 1987), insurers and property owners share parallel obligations under the Occupational Health and Safety Act (No. 85 of 1993), the National Building Regulations and Building Standards Act (No. 103 of 1977), and the National Environmental Management Act (No. 107 of 1998) to manage these evolving hazards responsibly.
The Compliance Context
Under Section 8 of the OHS Act, employers and property owners are required to identify and mitigate foreseeable risks, including electrical and fire hazards introduced by PV systems. Similarly, SANS 10400-T (Fire Protection) stipulates that any building modification, such as a rooftop solar installation, must maintain adequate fire resistance, access, and suppression measures.
The Fire Brigade Services Act, through Sections 8, 9, and 15, empowers fire authorities to act on risks and salvage property at risk, it also expects proactive prevention. Insurers, meanwhile, rely on the same statutory framework to evaluate reasonable practicability and due diligence in risk management, particularly when assessing claims arising from PV-related fires.
Insurance Exposure and Risk Alignment
In the insurance sector, PV fire incidents represent a critical overlap of electrical, structural, and environmental liability. Conventional firefighting often results in secondary water and electrical damage, extensive claim delays, and environmental contamination. These outcomes directly affect underwriting exposure, claims settlement timelines, and reputational risk.
Leading South African insurers — including Santam, Hollard, King Price, and Old Mutual Insure — already assess renewable energy risks under combined fire and engineering policies. However, many policies are yet to fully reflect the specific challenges posed by live DC systems during fires. Products like PVSTOP offer a practical solution that enables both risk mitigation and regulatory compliance by safely encapsulating live PV modules to de-energize them during emergencies.
Regulatory Integration and ESG Compliance
PVSTOP aligns directly with multiple South African statutes and standards:
- Fire Brigade Services Act (99/1987) – Recognised as “equipment” for fire prevention (Sec. 1(vii), Sec. 15).
- Occupational Health and Safety Act (85/1993) – Supports hazard identification and mitigation duties (Sec. 8).
- National Building Regulations – SANS 10400-T – Contributes to compliance with fire protection and access requirements.
- Disaster Management Act (57/2002) – Aids preparedness and response at municipal level.
- National Environmental Management Act (107/1998) – Prevents toxic runoff through non-hazardous, encapsulated nanoparticles.
By integrating PVSTOP into loss prevention protocols and underwriting frameworks, insurers can demonstrate alignment with national legislation, environmental stewardship, and ESG mandates increasingly demanded by both investors and global reinsurers.
The Case for Insurer Adoption
For insurers and risk engineers, recommending or requiring PV fire-mitigation systems is no longer a peripheral measure, it is a demonstrable act of compliance and prudent underwriting. Incorporating PVSTOP within insurer-approved risk-control lists delivers measurable benefits:
- Reduces fire spread, reignition, and secondary damage
- Accelerates site clearance and claim processing
- Minimises business interruption and income loss
- Provides proof of compliance with national safety regulations
- Strengthens insurer credibility in sustainability and ESG reporting
South Africa’s legal framework already supports the proactive use of PV fire-mitigation products. What is now required is alignment between insurers, risk assessors, and emergency services to close the compliance gap.
By integrating PVSTOP into their underwriting and loss-control policies, insurers not only reduce claims exposure but also uphold their duty to promote safety, environmental responsibility, and resilience across the renewable-energy sector.
Understanding PV Fire Hazards: A Simple Explanation
Direct Current (DC) power — generated by solar panels — behaves differently from the alternating current (AC) used inside buildings.
When sunlight hits a solar panel, electricity flows immediately and continuously through DC wiring, even if the system is switched off. Unlike AC power, which alternates direction and can be interrupted by circuit breakers, DC current flows in one constant direction and can continue to arc and sustain a fire if not properly isolated.
This means that during a building fire, as long as sunlight reaches the panels, the PV system remains live and dangerous. Conventional extinguishers or water cannot safely neutralize this energy source.
PVSTOP works by coating the solar modules with a special non-conductive film that blocks light from reaching the photovoltaic cells — effectively cutting off the source of power generation at its origin. Once the “sunlight source” is eliminated, the DC current stops, allowing responders and insurers to safely manage the fire scene, prevent reignition, and protect property and personnel.
Key Definitions for Non-Technical Readers
DC (Direct Current):
A continuous flow of electric charge in one direction, produced by solar panels whenever sunlight is present. Unlike AC, it cannot be switched off easily and remains energized during daylight and light.
AC (Alternating Current):
The standard form of electricity used in homes and offices, which changes direction rapidly and can be safely interrupted by circuit breakers.
Mitigation:
Any proactive step taken to reduce the severity or likelihood of an incident. In fire safety, mitigation includes systems or materials designed to limit fire spread, heat, or ignition.
ESG (Environmental, Social, and Governance):
A framework used by investors and insurers to evaluate the sustainability and ethical impact of an organization.
- Environmental considers ecological responsibility and pollution prevention.
- Social focuses on safety, fairness, and community well-being.
- Governance examines accountability and ethical management practices.
Insurers increasingly integrate ESG performance into underwriting and risk-assessment policies.
Reasonably Practicable (OHS Act Term):
A legal standard under Section 8 of the OHS Act that requires employers and property owners to take all steps that are feasible, given the risk level and available technology, to prevent harm.
Fire Re-Ignition:
When a fire that appears extinguished flares up again due to residual heat or live electrical current — a major risk in PV systems if DC power remains active.
Non-Conductive Coating:
A specialized layer or spray that does not carry electricity, used to insulate live equipment or prevent electric current flow — the principle behind PVSTOP’s light-blocking safety application.